The price of gold consolidates following the semi-annual testimony with Federal Reserve Chairman Jerome Powell, and the precious metal may face a larger pullback as the bullish momentum from the start of the year abates.
The price of gold tracks the monthly opening range amid the limited reaction to the Humphrey-Hawkins testimony, and developments surrounding the coronavirus may have a greater influence on gold prices as Chairman Powell warns that the outbreak “could lead to disruptions in China that spill over to the rest of the global economy.”
In response, authorities in China may attempt to ward off an economic shock by prescribing monetary as well as fiscal stimulus programs, and the threat to the global economy may trigger a response from major central banks as Chairman Powell tells US lawmakers that the Federal Open Market Committee (FOMC) would “respond accordingly” to a material change in the growth outlook.

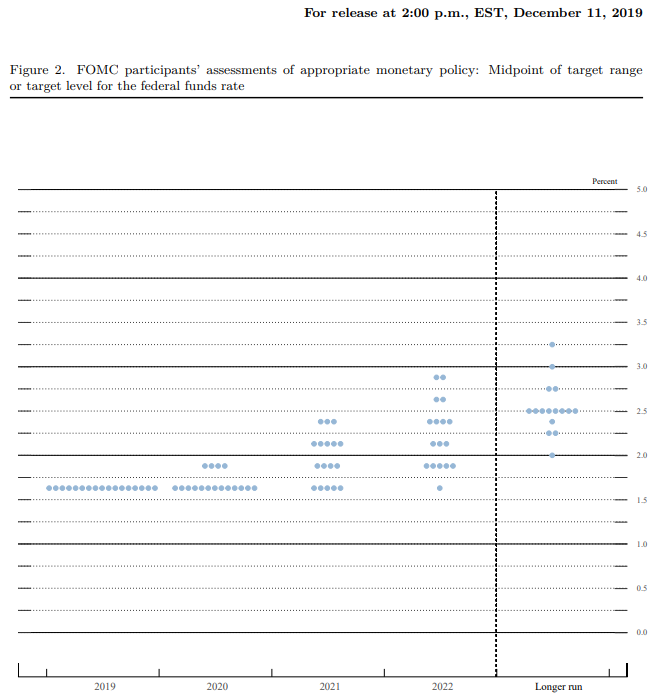
It remains to be seen if Fed officials will adjust the forward guidance when the central bank updates the Summary of Economic Projections (SEP) as Chairman Powell and Co. see the benchmark interest rate sitting around 1.50% to 1.75% throughout 2020, but the FOMC may come under pressure to implement lower interest rates as President Donald Trump tweets that the “Fed Rate is too high.”
In turn, market participants may look for an alternative to fiat-currencies as Chairman Powell insists that “policy is not on a preset course,” and the broader outlook for the price of gold remains constructive as the reaction to the former-resistance zone around $1447 (38.2% expansion) to $1457 (100% expansion) helped to rule out the threat of a Head-and-Shoulders formation as the region provided support.
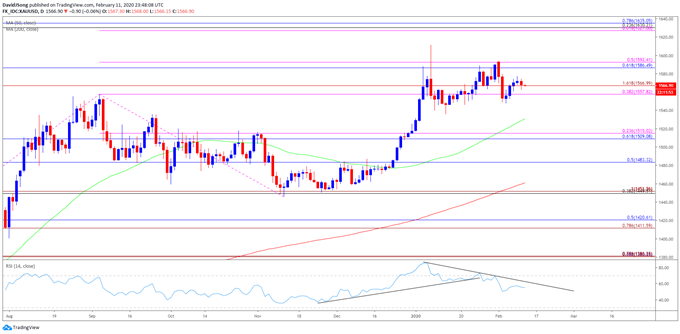
Nevertheless, the price for gold may continue to consolidate amid the limited reaction to the Fed testimony, and the bullish momentum from earlier this year may continue to abate as the Relative Strength Index (RSI) tracks the downward trend from the start 2020.
GOLD PRICE DAILY CHART
Source: Trading View
- The opening range for 2020 instilled a constructive outlook for the price of gold as the precious metal cleared the 2019 high ($1557), with the RSI pushing into overbought territory during the same period.
- However, recent developments in the RSI suggests the bullish momentum from the end of 2019 will continue to abate as the oscillator tracks the downward trend from the start of the year.
- The string of failed attempts to close above the Fibonacci overlap around $1587 (61.8% retracement) to $1592 (50% expansion) may keep gold within the monthly opening range, but lack of momentum to hold above the $1558 (38.2% expansion) to $1567 (161.8% expansion) region may push the price of bullion towards the January low ($1517), which lines up with the overlap around $1509 (61.8% retracement) to $1515 (23.6% expansion).
Source: Daily FX


