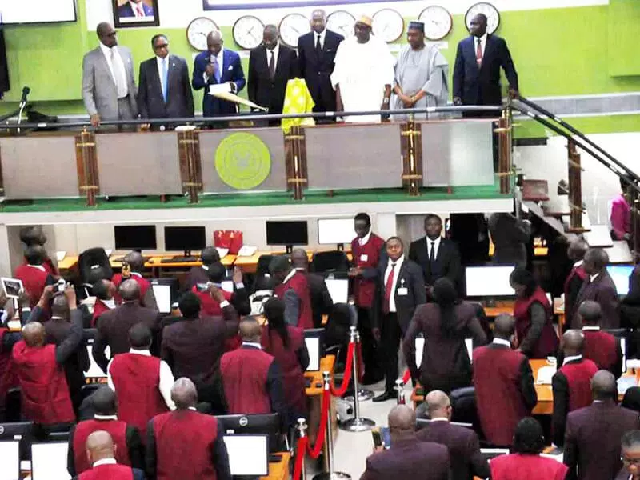
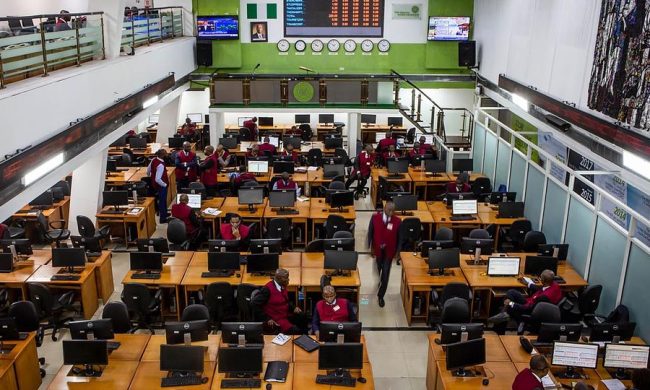
Transaction turnover in the Fixed Income and Currency (FIC) markets for March amounted to N15.66 trillion, a 24.68 per cent (N3.10 trillion) increase from the value recorded in February and a 16.26 per cent (N2.19 trillion) increase Year on Year. A breakdown of the contributions of the various segments of the markets to turnover in the review period shows that investors invested more money in the Foreign Exchange market than the others.
The FX market accounted for 39.06 per cent of total turnover in the March, followed by Treasury Bills (T-bills) with 35.69 per cent. Repurchase Agreement/Buy-Backs contributed 16.75 per cent of total turnover, while FGN Bonds was responsible for 7.37 per cent of turnover.
The value of transactions in the foreign exchange market settled at N6.12 trillion (about $18.67 billion) in March, representing an increase of 44.59 per cent or $5.76 billion when compared with the value recorded in February ($12.92 billion).
According to the OTC Monthly report released on Friday, liquidity flows through the I&E FX Window increased in March, as the total volumes traded for the month settled at $6.06 billion, representing a 55.38 per cent ($2.16 billion) decrease from the previous month.
“So far, the total volumes traded at the Window Year-to-Date stands at $15.21 billion. Exchange rates for the Naira traded relatively flat, as the Investors’ & Exporters’ (I&E) FX Window appreciated slightly to close the reporting month at $/N360.20 from $/N360.41 as at February 28, 2018, whilst also trading at a discount to the Parallel Market which appreciated slightly to close the month at $/N362.00 from of $/N363.00 as at February 28, 2018,” the report from FMDQ OTC Securities Exchange noted.
Member-Client trades was the biggest contributor to turnover growth in the FX Market in the month, standing at $10.98 billion, an increase of 47.50 per cent ($3.54 billion) from the previous month and an 84.12 per cent ($5.02 billion) increase YoY ($5.96 billion). This was followed by Member-CBN trades which recorded $5.70 billion in March ($4.11 billion in February), representing an increase of 38.48 per cent ($1.58 billion) and a 277.17 per cent ($4.19 billion) increase YoY ($1.51 billion) as the effect of the Secondary Market Intervention Sales (SMIS) continued to boost activity in the FX Market.
Inter-Member trades recorded $2 billion in March, an increase of 47.15 per cent ($0.64 billion) relative to the trades recorded in February ($1.36 billion), and a 237.28 per cent ($1.40 billion) increase YoY ($0.59 billion).
Turnover in the Fixed Income market for the month under review settled at N6.74 trillion, a 7.50 per cent increase (N0.47 trillion) MoM. Transactions in the T-bills market accounted for 82.94 per cent of the overall Fixed Income Market, a decrease from the 89 per cent recorded in February.
Outstanding T-bills at the end of the month stood at N13.21 trillion (N12.56 trillion in February), an increase of 5.18 per cent (N0.65 trillion). FGN bonds outstanding value also increased marginally to close at N7.82 trillion, from N7.74 trillion in February.
Trading intensity in the Fixed Income market for the month under review settled at 0.42 and 0.15 for T-bills and FGN bonds, respectively, from 0.44 and 0.09 recorded the previous month, respectively. T-bills within the six to 12 month maturity bucket became the most actively traded, accounting for a turnover of N2.93 trillion in March, while short and medium-term yields on the sovereign yield curve decreased by an average of 33 basis points (bps) and 11bps, respectively, as long-term yields gained an average of 0.13bps.
The spread between 10-year and 3-month benchmark yields closed negative at -1.22bps for March 2018 (-1.17bps in February), indicating an inverted yield curve Money Market (Repos/Buy-Backs and Unsecured Placements/Takings).
Meanwhile, activities in the secured Money Market (i.e. Repos/Buy-Backs) settled at N2.62 trillion in March, which was 29.19 per cent (N0.59 trillion) higher than the value recorded in February (N2.03 trillion). Year on Year, turnover on Repos/Buy-Backs recorded a 5.42 per cent (N0.13 trillion) increase from the value recorded in March 2017 (N2.49 trillion).
Unsecured Placements/Takings closed the month at a turnover of N135.92 billion, a 44.98 per cent increase (N42.17 billion) from the figure recorded in February (N93.75 billion) and a 15.19 per cent increase (N17.92 billion) on YoY basis (N118 billion as at March 2017).
Average O/N8 NIBOR9 for the period under review stood at 15.97 per cent (19.91 per cent in February), due to improved inter-bank liquidity Market Surveillance.
The number of executed trades captured on the E-Bond Trading System in March amounted to 14,055 as against 16,325 recorded in February, while executed T-bills trades decreased by 18.78 per cent (2,639) to 11, 413 in March (14,052 in February). FGN bonds increased by 16.23 per cent (369), to 2,642 in March (2,273 in February).


