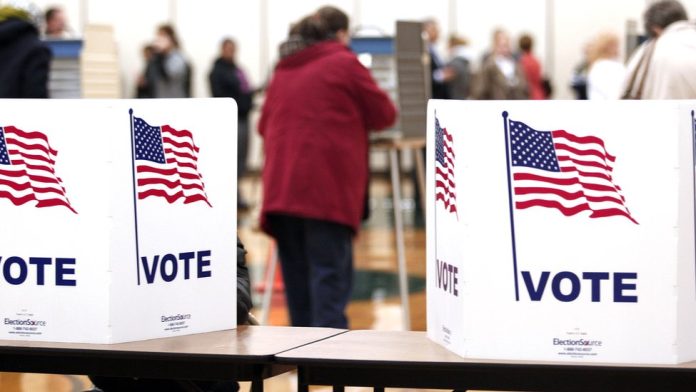
The 2024 election was initially shaping up to be a rematch of 2020, but in July, everything changed when President Joe Biden withdrew from the race and endorsed Vice President Kamala Harris.
Now, the key question is: will the U.S. see its first woman president, or will Donald Trump secure a second term? As election day nears, we’re closely monitoring the polls to gauge the impact of the campaigns on the race for the White House.
Who’s Leading in the National Polls?
Since entering the race in late July, Harris has maintained a lead over Trump in national polling averages, as shown in the latest rounded figures below.
The two contenders squared off in a televised debate in Pennsylvania on September 10, drawing an audience of over 67 million viewers.
Polling in the week following the debate indicated a slight boost for Harris, with her lead growing from 2.5 percentage points on debate day to 3.3 points a week later. However, most of this increase stemmed from a dip in Trump’s numbers, which dropped by half a percentage point after the debate.
The chart below shows these shifts in poll averages, illustrating both the trends over time and individual poll results for each candidate.
https://flo.uri.sh/visualisation/19298662/embed?auto=1
While national polls offer insight into overall popularity, they aren’t always reliable predictors of the election outcome due to the U.S. electoral college system. In this system, 538 electoral votes are distributed across states, and a candidate must secure 270 to win.
Though there are 50 states, most consistently vote for the same party, so only a handful of battleground states—where both candidates have a chance—will determine the election.
https://flo.uri.sh/visualisation/19403381/embed?auto=1
Who’s Leading in the Swing States?
Right now, the polling averages show a tight race in the seven key battleground states, with just one or two percentage points separating Harris and Trump.
Pennsylvania, the most crucial of these states due to its high electoral vote count, is pivotal for both candidates’ chances of reaching the 270 mark.
When Biden dropped out, he was trailing Trump by nearly five points in these battleground states. However, since Harris entered the race, polling trends indicate she’s in a stronger position in some key states.
In particular, Harris has led in Michigan, Pennsylvania, and Wisconsin since early August, although the margins remain narrow. These states were traditionally Democratic strongholds until Trump flipped them in 2016. Biden reclaimed them in 2020, and if Harris can do the same, she’ll be well-positioned to win.
https://flo.uri.sh/visualisation/19161574/embed?auto=1
How Are These Polling Averages Calculated?
The figures in the graphics are based on averages calculated by polling analysis site FiveThirtyEight (538), which aggregates data from various national and state polls.
https://flo.uri.sh/visualisation/19469351/embed?auto=1
538 applies strict criteria for poll inclusion, ensuring that only surveys that disclose essential details, such as sample size and methodology, are counted.
Can the Polls Be Trusted?
Current polls suggest a close race in swing states, with only a few points separating Harris and Trump. When elections are this tight, it becomes difficult to predict the outcome with certainty.
Polls underestimated Trump’s support in both 2016 and 2020, and polling companies are working to adjust their methods to better capture voter sentiment. However, polling adjustments are complex, and predicting turnout on election day remains a challenge.
As election day approaches, these small margins in key states suggest a competitive and unpredictable race.


